You’ve launched a brand advocacy program, empowering your most passionate customers and employees to share their love for your brand. They’re creating content, sharing posts, and talking you up to their networks. But how do you know if it’s actually working? Without the right data, your program is just a collection of hopeful activities, not a strategic asset. To prove its value and make smart improvements, you need to track the right brand advocacy metrics.
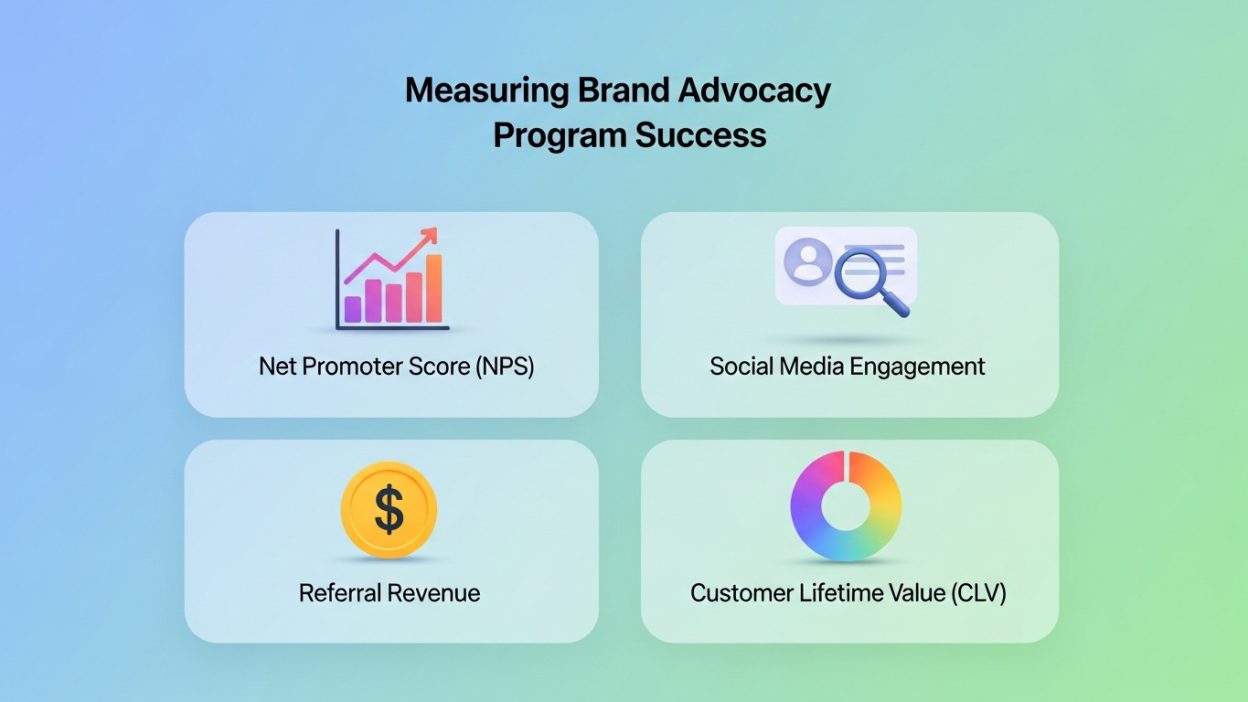
Brand Advocacy measuring the success of your advocacy program isn’t just about counting likes and shares; it’s about understanding the impact of your efforts. It’s about understanding the real impact on your brand’s reach, engagement, and ultimately, your bottom line. By focusing on specific key performance indicators (KPIs), you can gain a clear picture of what’s effective, what’s not, and where you can optimize your strategy for even better result.
This guide will walk you through the essential metrics you need to monitor to effectively measure brand advocacy. We’ll explore KPIs across participation, reach, engagement, and conversion, helping you demonstrate the tangible value of your efforts and secure continued investment in your program.
Key Participation Metrics for Your Advocacy Program
Before you can measure the impact of your advocates’ activities, you first need to understand how engaged they are with the program itself. Participation metrics are the foundation for assessing the health of your advocacy efforts. A program with low participation is a clear sign that something needs to be adjusted.
Advocate Activation Rate
The activation rate is the percentage of individuals who were invited and actually joined and participated in your program. It’s one of the first indicators of your program’s appeal. If you invite 200 customers to become advocates and only 20 sign up, your activation rate is 10%. A low rate might mean that your invitation isn’t compelling enough, the sign-up process is too complicated, or the incentives aren’t attractive enough.
Active Participation Rate
This metric tracks the percentage of your enrolled advocates who regularly engage with your program. Are they logging in, viewing content, and completing advocacy tasks? You can define “active” based on your program’s goals, such as sharing at least one piece of content per month. Tracking the active participation rate helps you understand the ongoing health of your community. A decline in this metric could signal content fatigue or a need for new, more exciting challenges.
Content Sharing Frequency
How often are your advocates sharing the content you provide? This metric gives you insight into their level of commitment and the relevance of your content. If advocates share content multiple times a week, it indicates they are highly engaged and find the content valuable. If sharing is infrequent, you might need to reassess the quality or type of content you’re offering. Is it easy to share? Does it resonate with their personal brand? Answering these questions can help you boost this crucial metric.
Measuring the Reach of Your Brand Advocacy

Once you have a healthy level of participation, the next step is to measure how far your advocates’ messages are traveling. Reach metrics help you quantify the earned media value your program is generating, showing how your brand is being exposed to new audiences.
Potential Reach
Social proof potential reach is the total number of people who could theoretically see a post from your brand advocates. It’s calculated by adding up the total number of followers or connections each advocate has across their social networks. For example, if an advocate with 1,000 LinkedIn connections and 500 Twitter followers shares your content, their potential reach is 1,500. This metric is a powerful way to demonstrate the scale of your program’s influence.
Impressions
While potential reach shows what’s possible, impressions tell you how many times your advocates’ content was actually displayed in users’ feeds. This is a more concrete measure of visibility than potential reach alone. Most social media platforms provide impression data, which can be aggregated to show the total number of times your brand’s message appeared on screens thanks to your advocates.
Website Traffic from Advocacy
A key goal for any brand advocacy program is to drive traffic back to your website. Using UTM parameters CPA for the links your advocates share is essential for tracking this. In Google Analytics, you can create a specific segment for advocacy-driven traffic to see exactly how many visitors are coming from your program. You can also analyze their on-site behavior, such as pages visited and time spent on site, to gauge the quality of this traffic.
Tracking Engagement for Advocacy Program Success
Reach is important, but engagement is where you see if the message is truly resonating. Engagement metrics show you how audiences are interacting with the content your advocates share. High engagement is a strong indicator of quality content and authentic advocacy.
Likes, Comments, and Shares
These are the fundamental social media engagement metrics. Tracking the total number of likes, comments, and shares on your advocates’ posts helps you understand which content pieces are performing best. A high number of comments, in particular, can indicate that a post has sparked a meaningful conversation, which is a significant win for brand advocacy.
Click-Through Rate (CTR)
The click-through rate (CTR) is the percentage of people who clicked on a link within an advocate’s post. This is a critical metric for measuring the effectiveness of the shared content. A high CTR suggests that the advocate’s message and the content itself were effective at capturing the audience’s interest and encouraging them to learn more. As with website traffic, UTM codes are vital for accurately tracking CTR from advocacy efforts.
Cost Per Click (CPC) and Earned Media Value (EMV)
To translate engagement into financial terms, you can calculate the earned media value (EMV). One way to do this is to examine the Cost Per Click (CPC). Find out what you would typically pay for a click from a paid ad campaign targeting a similar audience. Then, multiply that CPC by the number of clicks generated by your advocates. For example, if your average CPC is $2.00 and your advocacy program generated 1,000 clicks, you’ve gained $2,000 in earned media value. This is a powerful metric to present to stakeholders.
How to Measure Brand Advocacy’s Impact on Conversions
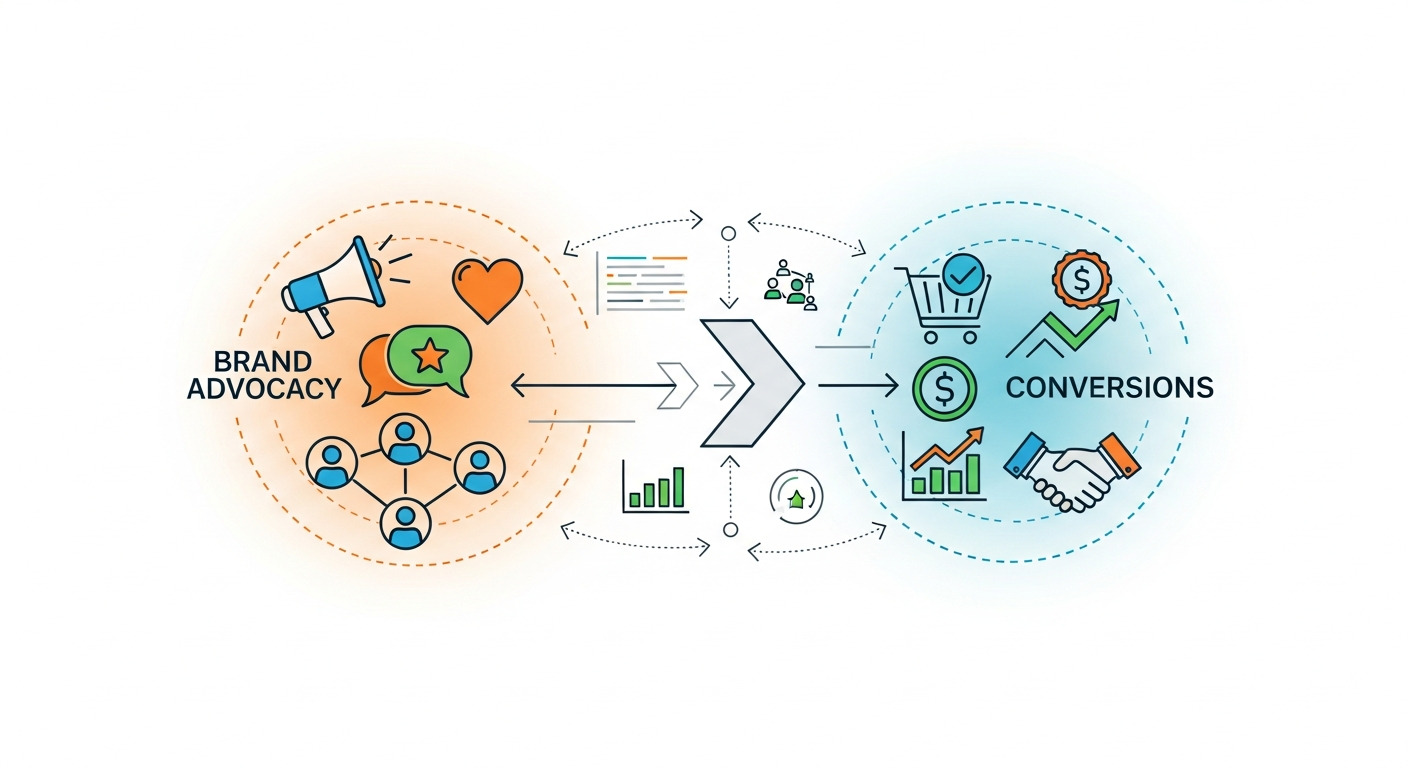
Ultimately, the primary goal of brand advocacy is to influence real business outcomes, not just awareness or engagement. Conversion metrics help bridge the gap between advocacy activity and tangible results like leads, sales, and revenue. By tracking how advocate-driven traffic behaves compared to other channels, you can clearly see the financial impact of authentic recommendations. To measure this effectively, monitor conversions coming from advocate-shared links, referral programs, and user-generated content. Use tools like UTM parameters, referral tracking, and CRM integration to attribute sign-ups, purchases, or demo requests back to advocacy efforts. Comparing conversion rates, average order value, and customer lifetime value from advocacy-driven users versus paid channels further strengthens the case for advocacy.
Leads Generated
How many new leads has your advocacy program produced? By tracking link clicks that lead to form submissions (such as for a webinar, demo, or newsletter), you can directly attribute new leads to your advocates. Ensure your landing pages and forms are set up to capture this referral data. Seeing a steady stream of leads from your advocacy program is a clear sign of a positive ROI.
Sales and Revenue Attribution
This is the holy grail of brand advocacy metrics. Attributing sales to your program requires a robust tracking setup, often involving your CRM. By tracking a lead from their first click on an advocate’s link all the way through to a closed deal, you can calculate the exact amount of revenue generated. This allows you to demonstrate a direct financial return on your investment in the program.
Cost Per Acquisition (CPA)
Cost Per Acquisition helps you understand how efficiently your brand advocacy program turns engagement into actual customers. To calculate CPA, divide the total cost of running your advocacy program—including platform subscriptions, incentives or rewards, content creation, and management time—by the number of new customers acquired through advocacy efforts. Comparing this figure with CPA from other channels such as paid ads, influencer marketing, or email campaigns provides valuable context. In many cases, brand advocacy delivers a significantly lower CPA because recommendations come from trusted voices rather than paid placements. A lower CPA highlights the cost-effectiveness of advocacy and reinforces its long-term value as a sustainable, high-ROI growth channel.
Build a Stronger Program with Data

A successful brand advocacy program is built on passion, but it’s proven with data. By diligently tracking metrics related to participation, reach, engagement, and conversions, you can move beyond guesswork and truly understand the impact of your program. Use these insights to celebrate your advocates, refine your strategy, and demonstrate the incredible value that authentic word-of-mouth marketing brings to your organization. When you can measure brand advocacy effectively, you can manage it for long-term success.
Turning Metrics into Action
Tracking these brand advocacy metrics is only half the battle. The real power comes from using this data to refine and optimize your program. If engagement is low, experiment with different types of content to see what works best. If the activation rate is poor, review and refine your invitation process. By continuously analyzing your results and making data-driven adjustments, you can ensure your brand advocacy program remains a powerful engine for growth. For businesses focused on building a brand advocacy program, this ongoing optimization is the key to long-term success.
Conclusion
Measuring advocacy isn’t just about numbers—it’s about understanding the real impact of authentic word-of-mouth on brand growth. By tracking key metrics like engagement, reach, and advocacy ROI , you can see how effectively your supporters amplify your message.
Data-driven insights help refine strategy, improve content relevance, identify top advocates, and demonstrate value to leadership. With consistent tracking and optimization, advocacy becomes a sustainable driver of trust, visibility, and long-term brand loyalty.
Frequently Asked Questions (FAQs)
1. What is brand advocacy?
Brand advocacy is when customers, employees, or partners voluntarily promote a brand based on positive experiences. These advocates share content, recommend products, and influence purchasing decisions through trusted, authentic communication.
2. What is the most important brand advocacy metric?
There is no single “most important” metric—it depends on your program’s goals. However, metrics tied directly to business impact, such as leads generated, conversions, and revenue attribution, are most valuable for demonstrating ROI to leadership.
3. How often should brand advocacy metrics be reported?
Monthly reporting is ideal for identifying trends and performance shifts. For campaign-level insights, tracking engagement and reach on a weekly basis can provide faster optimization opportunities.
4. What tools can be used to measure brand advocacy performance?
Brand advocacy platforms typically include built-in analytics dashboards. Google Analytics is essential for tracking traffic and conversions, while UTM parameters help connect advocacy activity to measurable outcomes across platforms.
5. How do I choose the right people for a brand advocacy program?
Start with individuals already enthusiastic about your brand. Customers with high NPS scores and employees who actively engage online, communicate confidently, and align with company values make the strongest advocates.
6. What type of content works best for advocacy programs?
Authentic, easy-to-share content performs best. This includes customer success stories, product tips, industry insights, behind-the-scenes content, thought leadership, and engaging formats like videos and infographics.
7. How long does it take to see results from a brand advocacy program?
Most programs begin seeing increased reach and engagement within 60–90 days. Full ROI, including sales and revenue attribution, typically becomes clear after 4–6 months of consistent participation.
8. How do you measure ROI from brand advocacy?
ROI is measured by tracking traffic, leads, conversions, and revenue generated through advocacy links. Comparing these results against program costs provides a clear view of performance and profitability.
9. Can brand advocacy help with lead generation?
Yes. Advocacy programs often generate high-quality leads because recommendations come from trusted sources, resulting in higher conversion rates compared to traditional advertising.
10. Is brand advocacy more effective than paid advertising?
Brand advocacy is often more trusted and cost-effective, but it works best alongside paid advertising. Advocacy builds long-term trust, while paid ads deliver immediate reach.
11. How do you keep advocates engaged over time?
Consistent communication, recognition, incentives, and fresh content are key. Providing clear value and celebrating advocate contributions helps sustain long-term participation.
12. Is brand advocacy suitable for small businesses?
Yes. Brand advocacy is highly scalable and budget-friendly, making it especially effective for small businesses looking to build trust, expand reach, and grow organically.